Agent Performance
Agent Performance provides comprehensive metrics and analytics for your trading agent. This guide explains what each metric means, how they're calculated, and how to interpret your agent's performance.
Overview
Agent Performance shows:
| Component | Description |
|---|---|
| Key Metrics | Portfolio balance, profit/loss, win rate, and more |
| Balance History Chart | Visual portfolio performance over time |
| Live Positions Table | Currently open positions |
| Recent Trades Table | Recently closed positions |
Access performance metrics on the Performance Overview page, accessible from the sidebar or at /dashboard/performance-overview.
Key Metrics
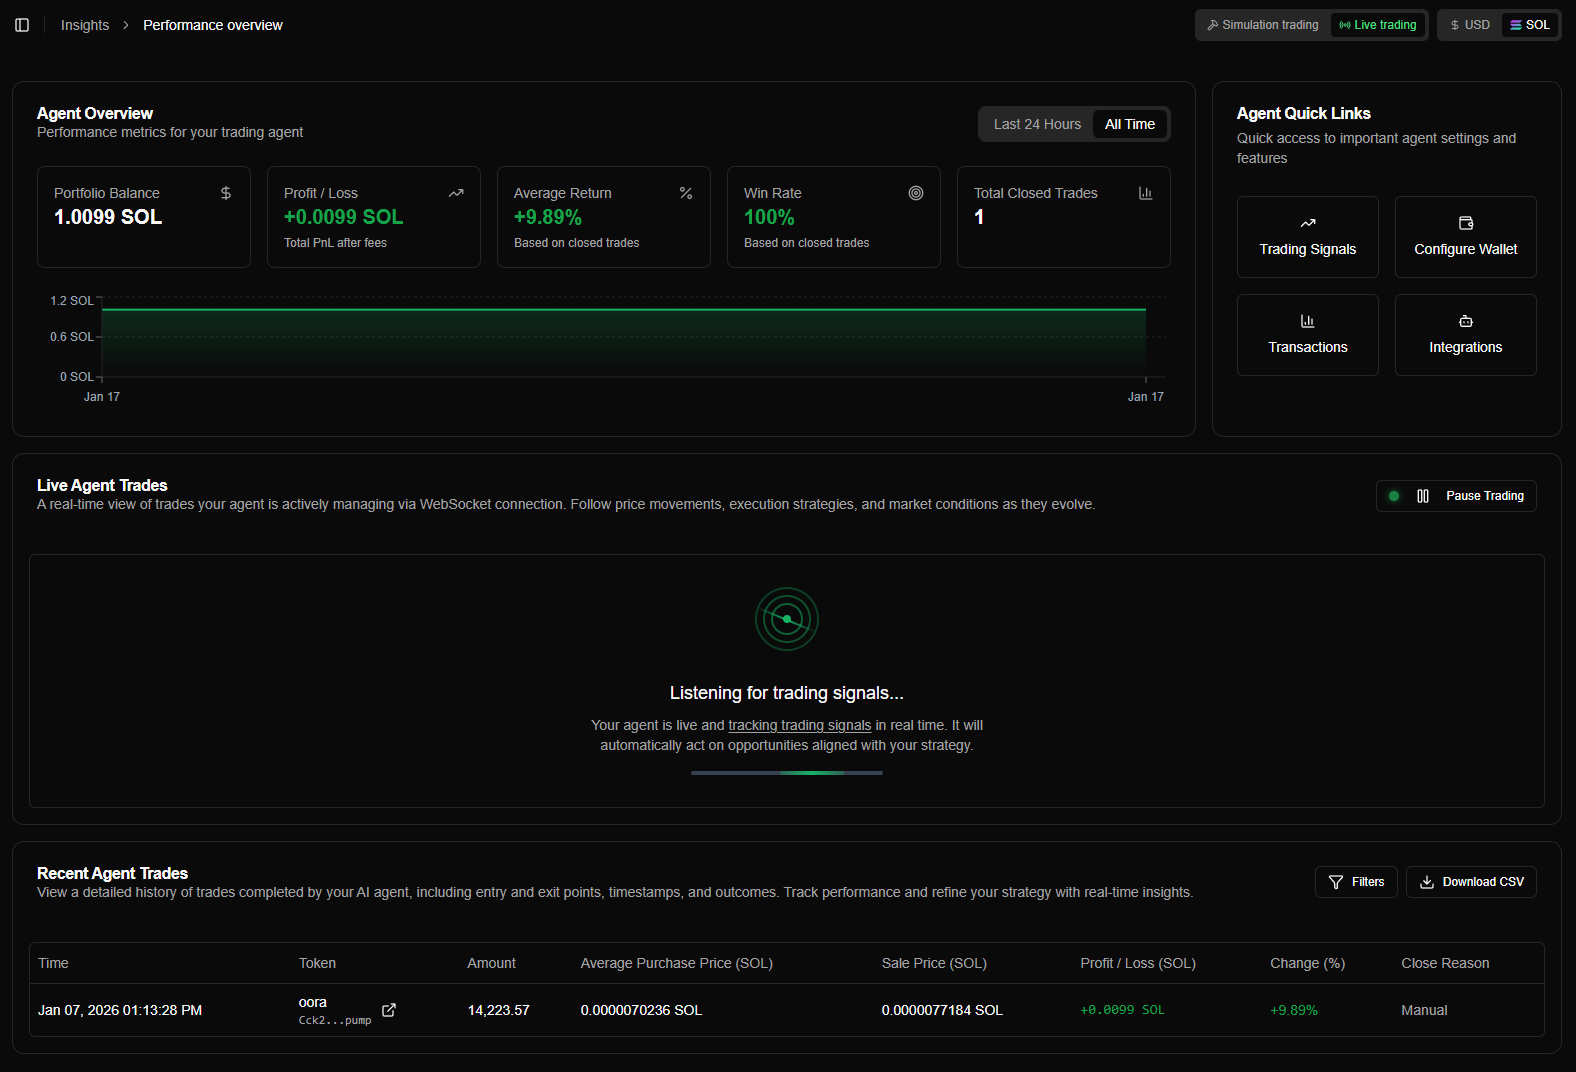
The Performance Overview displays four key metric cards at the top:
Portfolio Balance
What it is: Current total balance including all open positions and available funds.
Calculation:
Portfolio Balance = SOL Balance + Total Position ValuesIncludes:
| Component | Description |
|---|---|
| Available SOL | SOL in wallet (not tied to positions) |
| Position Values | Current value of all open positions (current price × amount) |
Example:
- SOL Balance: 5 SOL
- Position 1 value: 2 SOL (1000 tokens × $0.002)
- Position 2 value: 1.5 SOL (750 tokens × $0.002)
- Portfolio Balance: 8.5 SOL
Portfolio balance updates in real-time as position prices change.
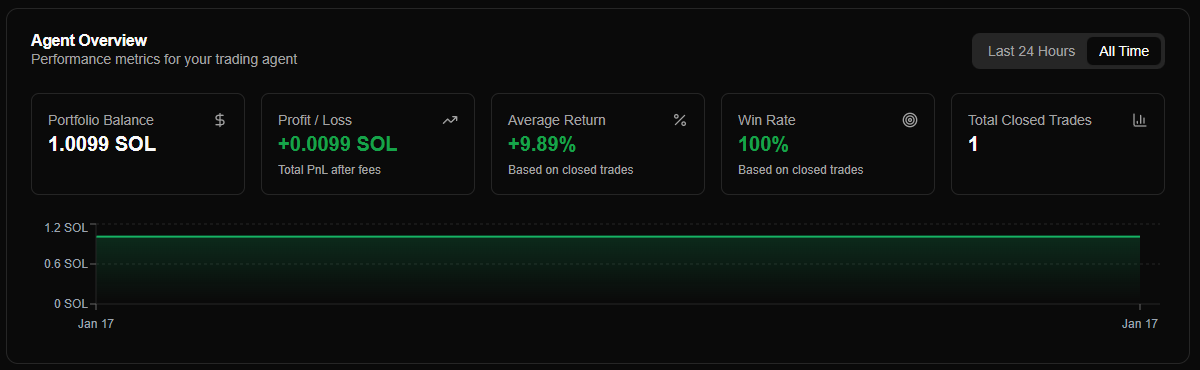
Four metric cards showing portfolio balance, profit/loss, average return, and win rate
Understanding Profit/Loss
Profit/Loss is broken down into two components:
Realized Profit/Loss
What it is: Profit/loss from closed positions only.
Calculation: Sum of all profitLossSol from closed trades in the database.
Example:
- Closed trade 1: +1.5 SOL profit
- Closed trade 2: -0.5 SOL loss
- Closed trade 3: +1.0 SOL profit
- Realized P/L: +2.0 SOL
Characteristics:
| Characteristic | Description |
|---|---|
| Based on Actual Sales | From executed sales |
| Fixed Once Closed | Doesn't change after position closes |
| Includes All Closed Trades | Both wins and losses |
Realized P/L represents profits and losses that are locked in from completed trades.
Balance History Chart
The balance history chart shows your portfolio balance over time:
Chart Features
| Feature | Description |
|---|---|
| 24h View | Last 24 hours of balance changes (hourly snapshots) |
| All Time View | Complete balance history since agent creation (daily snapshots) |
| Real-Time Updates | Chart updates automatically as balance changes |
Timeframe Selection
Toggle between timeframes using the tabs above the chart:
| Timeframe | Data Points | Update Frequency |
|---|---|---|
| 24h | Hourly snapshots | Every 30 seconds |
| All Time | Daily snapshots | Every 30 seconds |
How it works:
- System takes balance snapshots automatically (hourly for 24h, daily for all time)
- Chart displays snapshots as data points
- Latest point extends to current balance (real-time)
Interpreting the Chart
| Pattern | Description |
|---|---|
| Upward Trend | Portfolio balance increasing over time (profitable) |
| Downward Trend | Portfolio balance decreasing over time (losing) |
| Flat Line | Portfolio balance stable (little change) |
| Volatile | Large swings in portfolio balance (high volatility) |
Performance Metrics Explained
Realized vs Unrealized Profit/Loss
| Type | Source | Status | Based On |
|---|---|---|---|
| Realized | Closed positions only | Fixed once position closes | Actual executed sales |
| Unrealized | Open positions only | Changes with current prices | Real-time price feeds |
Why it matters:
| Metric | What It Shows |
|---|---|
| Realized | What you've actually earned |
| Unrealized | Potential profit/loss from open positions |
| Total | Overall performance (realized + unrealized) |
Example:
- Realized: +5 SOL (from 10 closed trades)
- Unrealized: -2 SOL (from 3 open positions)
- Total: +3 SOL (overall performance)
Timeframe Filtering
Performance metrics can be filtered by timeframe:
| Timeframe | Description | What's Included |
|---|---|---|
| 24h | Last 24 hours | Only data from the past 24 hours |
| All Time | Since agent creation | All data since agent was created |
What Changes with Timeframe
| Metric | Behavior |
|---|---|
| Average Return | Only includes closed trades within timeframe |
| Win Rate | Only includes closed trades within timeframe |
| Realized Profit/Loss | Only includes closed trades within timeframe |
| Total Profit/Loss | Historical data filtered, but unrealized P/L always current |
What Doesn't Change
| Metric | Behavior |
|---|---|
| Portfolio Balance | Always current (includes all positions and balance) |
| Unrealized Profit/Loss | Always current (based on current prices) |
| Total Open Positions | Always current (includes all open positions) |
Use 24h timeframe to see short-term performance. Use All Time to see overall agent performance since creation.
Real-Time Updates
Performance metrics update in real-time:
| Metric | Update Source | Update Frequency |
|---|---|---|
| Portfolio Balance | WebSocket + API | Continuous (sub-second) |
| Unrealized P/L | WebSocket | Continuous (sub-second) |
| Total P/L | WebSocket + API | Continuous (sub-second) |
| Open Positions | WebSocket | Continuous (sub-second) |
| Realized P/L | API polling | Every 10 seconds |
| Average Return | API polling | Every 10 seconds |
| Win Rate | API polling | Every 10 seconds |
| Balance History | API polling | Every 30 seconds |
No page refresh needed: All metrics update automatically via WebSocket and API polling.
Currency Display
Metrics can be displayed in SOL or USD:
| Currency | Description | Use Case |
|---|---|---|
| SOL | Native Solana currency | Trading view, SOL-focused strategies |
| USD | US Dollar equivalent | Portfolio valuation, USD-based tracking |
Conversion:
- USD values use real-time SOL/USD price from Pyth Network
- All metrics convert simultaneously
- Toggle anytime to switch currency view
Toggle location: Top header next to trading mode toggle.
Trading Mode Filtering
Performance metrics are filtered by trading mode:
| Mode | Filter |
|---|---|
| Simulation | Only simulation wallet data |
| Live | Only live wallet data |
What's Filtered
| Component | Filtering |
|---|---|
| All Metrics | Balance, P/L, win rate, etc. |
| Balance History Chart | Mode-specific balance history |
| Open Positions Table | Only positions in current mode |
| Recent Trades Table | Only trades in current mode |
How it works:
- Each trading mode uses a different wallet address
- Metrics are filtered by wallet address
- Switching modes shows completely separate performance
Simulation and Live modes have completely separate metrics. Switch between modes to view performance for each independently.
Interpreting Performance
Good Performance Indicators
Positive signs:
| Indicator | Description |
|---|---|
| Total Profit/Loss | Positive and growing |
| Win Rate | Above 50% (more wins than losses) |
| Average Return | Positive (profitable on average) |
| Balance History | Upward trend over time |
Example:
- Total P/L: +10 SOL
- Win Rate: 65%
- Average Return: +8%
- Balance trend: Steady upward slope
Common Questions
Why doesn't win rate include open positions?
Answer: Win rate is calculated from closed positions only. Open positions don't have a final profit/loss yet, so they can't be counted as wins or losses until they close.
How is average return calculated?
Answer: Average return = Sum of all trade returns (%) / Number of closed trades. Only closed positions are included in the calculation.
What's the difference between realized and unrealized P/L?
Answer:
- Realized: Profit/loss from closed positions (locked in)
- Unrealized: Profit/loss from open positions (changes with current prices)
Why is portfolio balance different from my wallet balance?
Answer: Portfolio balance includes both wallet balance AND the current value of all open positions. Wallet balance is only the available SOL, while portfolio balance is total portfolio value.