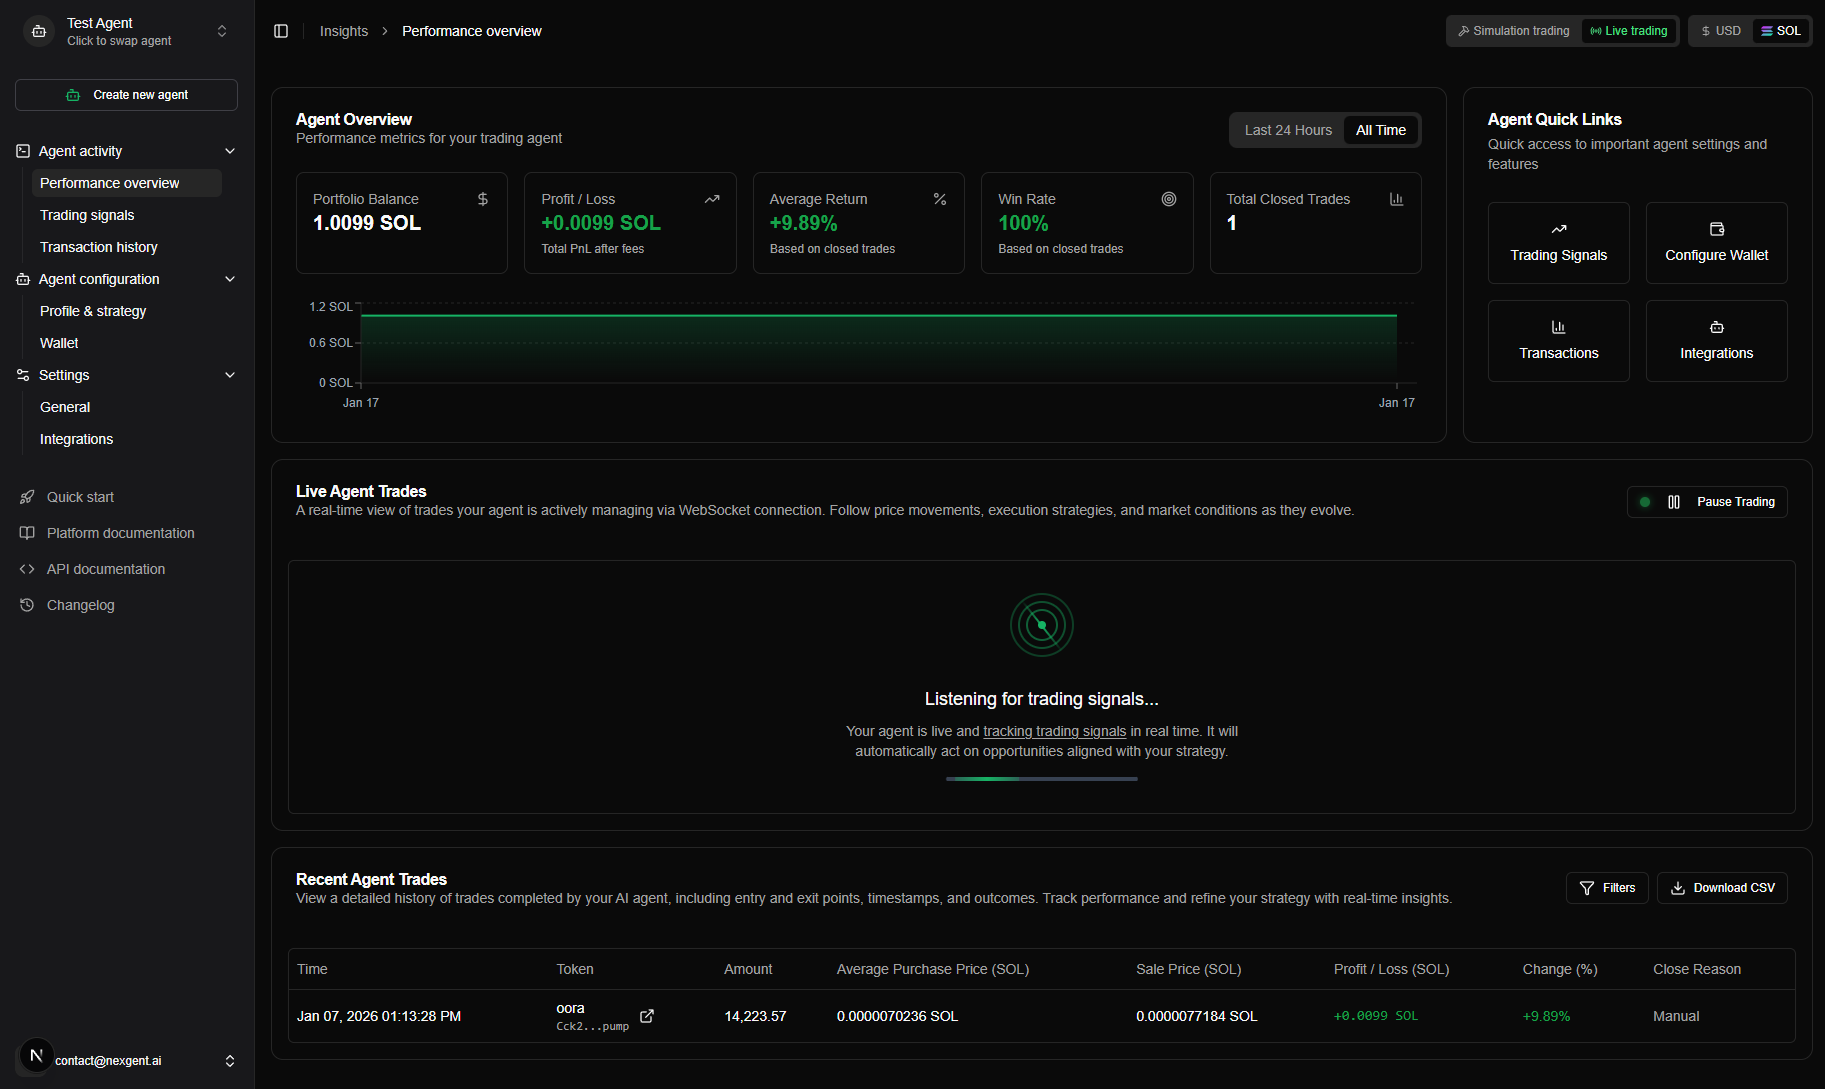
Dashboard Overview
Welcome to the Nexgent AI dashboard - your central hub for managing trading agents, monitoring performance, and controlling your automated trading strategy.
Dashboard Layout
The dashboard is organized into three main areas:
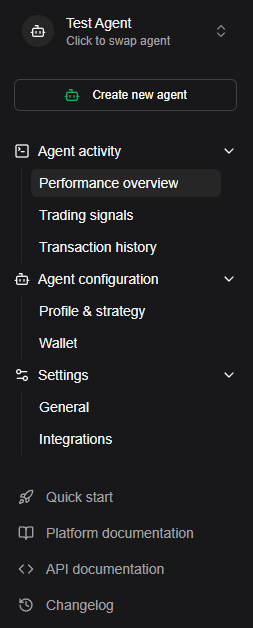
1. Sidebar Navigation
The left sidebar provides quick access to all major features:
| Section | Features |
|---|---|
| Agent Activity | Performance Overview, Trading Signals, Transaction History |
| Agent Configuration | Profile & Strategy, Wallet management |
| Settings | General settings, Integrations |
| Resources | Documentation, API reference, changelog |
2. Main Content Area
The center panel displays the current page content:
- Performance metrics and charts
- Position tables
- Configuration forms
- Transaction history
3. Header Bar
The top header includes:
| Feature | Description |
|---|---|
| Breadcrumb navigation | Shows your current location |
| Agent Switcher | Switch between different trading agents |
| Trading Mode Toggle | Switch between Simulation and Live modes |
| Currency Toggle | View values in SOL or USD |

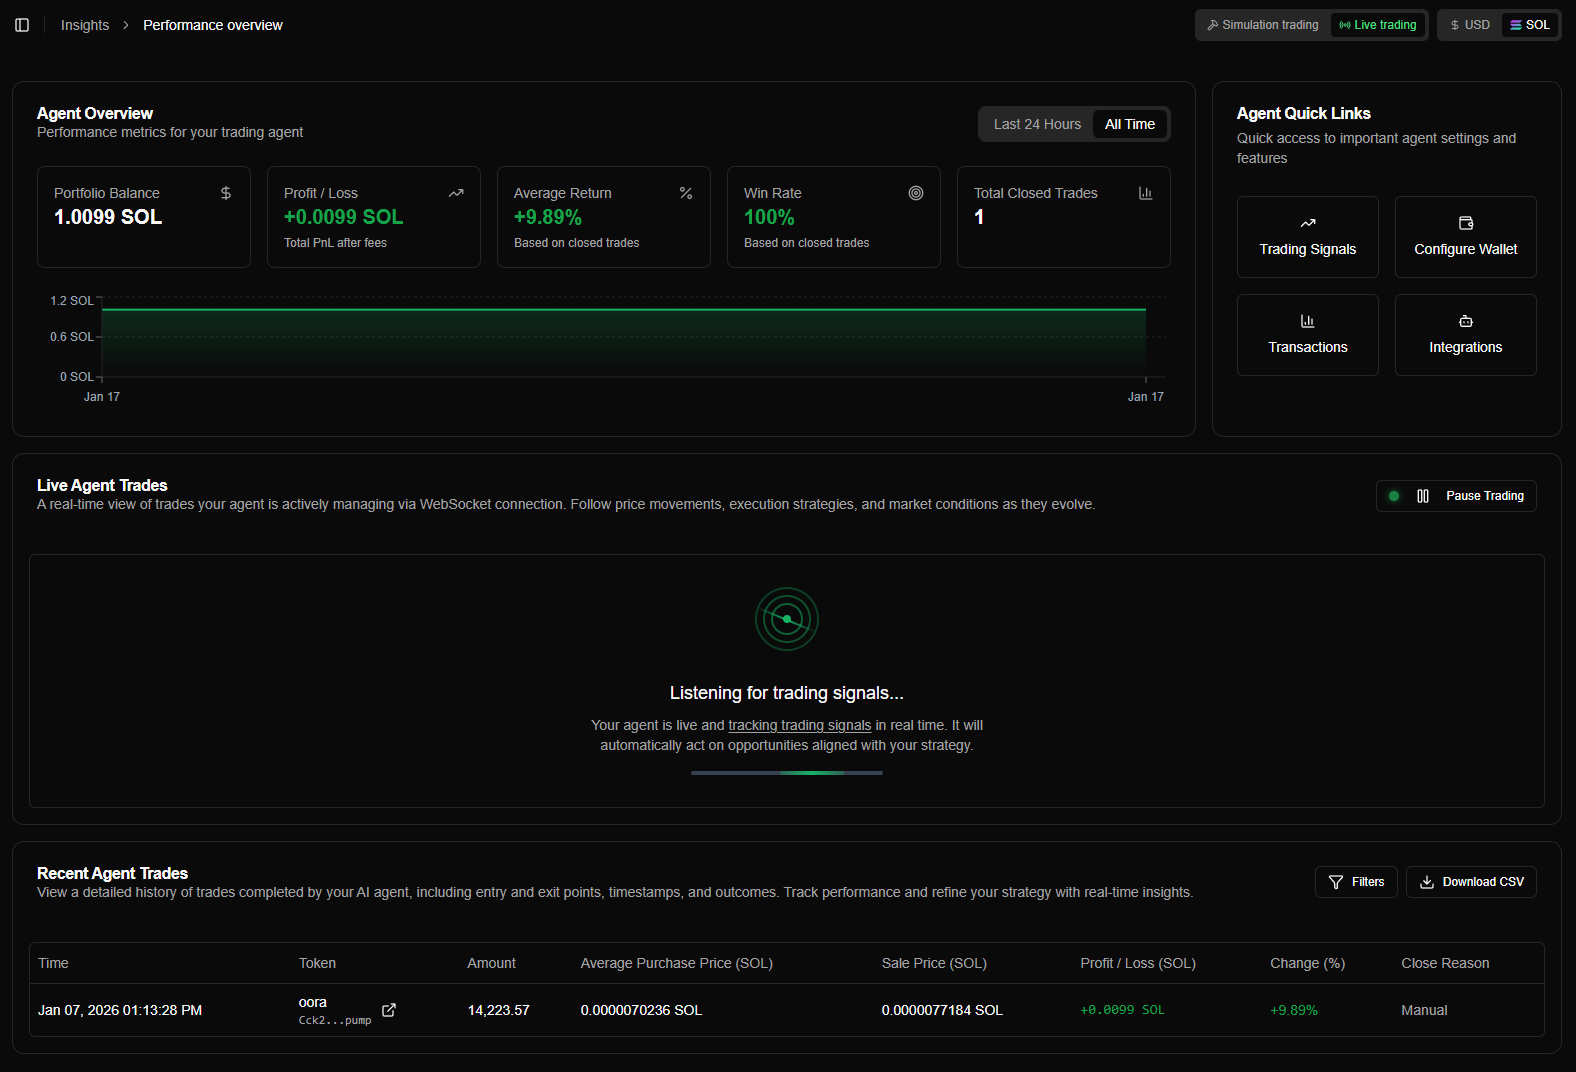
Performance Overview
The Performance Overview page is your main dashboard - accessed by clicking "Performance Overview" in the sidebar. It provides a comprehensive view of your agent's activity.
Key Metrics Cards
At the top of the page, you'll see four key metric cards:
| Metric | Description |
|---|---|
| Portfolio Balance | Current total balance (SOL or USD) - includes all open positions and available funds |
| Total Profit/Loss | Net profit or loss across all trades - green for profit, red for loss |
| Average Return | Average return percentage per trade - calculated from all closed positions |
| Win Rate | Percentage of profitable trades - based on closed positions only |
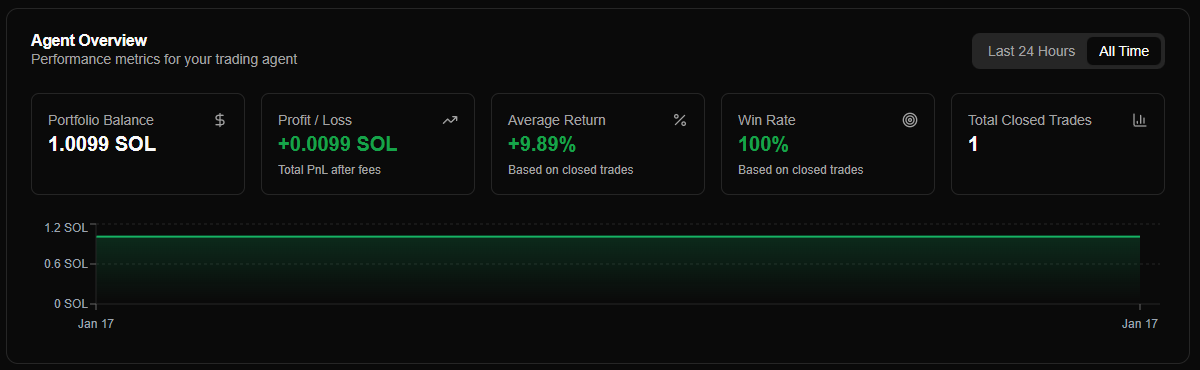
Balance History Chart
A visual chart showing your portfolio balance over time:
| View | Description |
|---|---|
| 24h View | Last 24 hours of balance changes |
| All Time View | Complete balance history since agent creation |
The chart updates in real-time as your balance changes from trades, DCA purchases, or position closures.
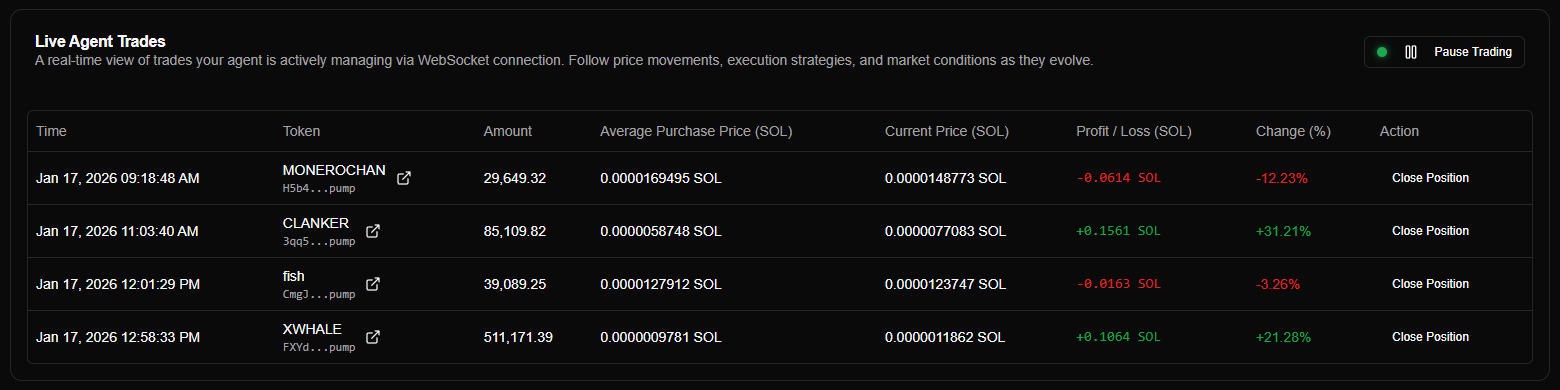
Live Positions Table
A table showing all currently open positions:
| Column | Description |
|---|---|
| Time | Position creation time |
| Token | Token symbol and name |
| Amount | Position size |
| Average Purchase Price | Average purchase price (SOL or USD based on preference) |
| Current Price | Current market price (SOL or USD based on preference) |
| Profit/Loss | Profit/loss amount (SOL or USD based on preference) |
| Change % | Percentage change from purchase price |
| Action | Manual close position button |
Positions update automatically via WebSocket connection - no page refresh needed.
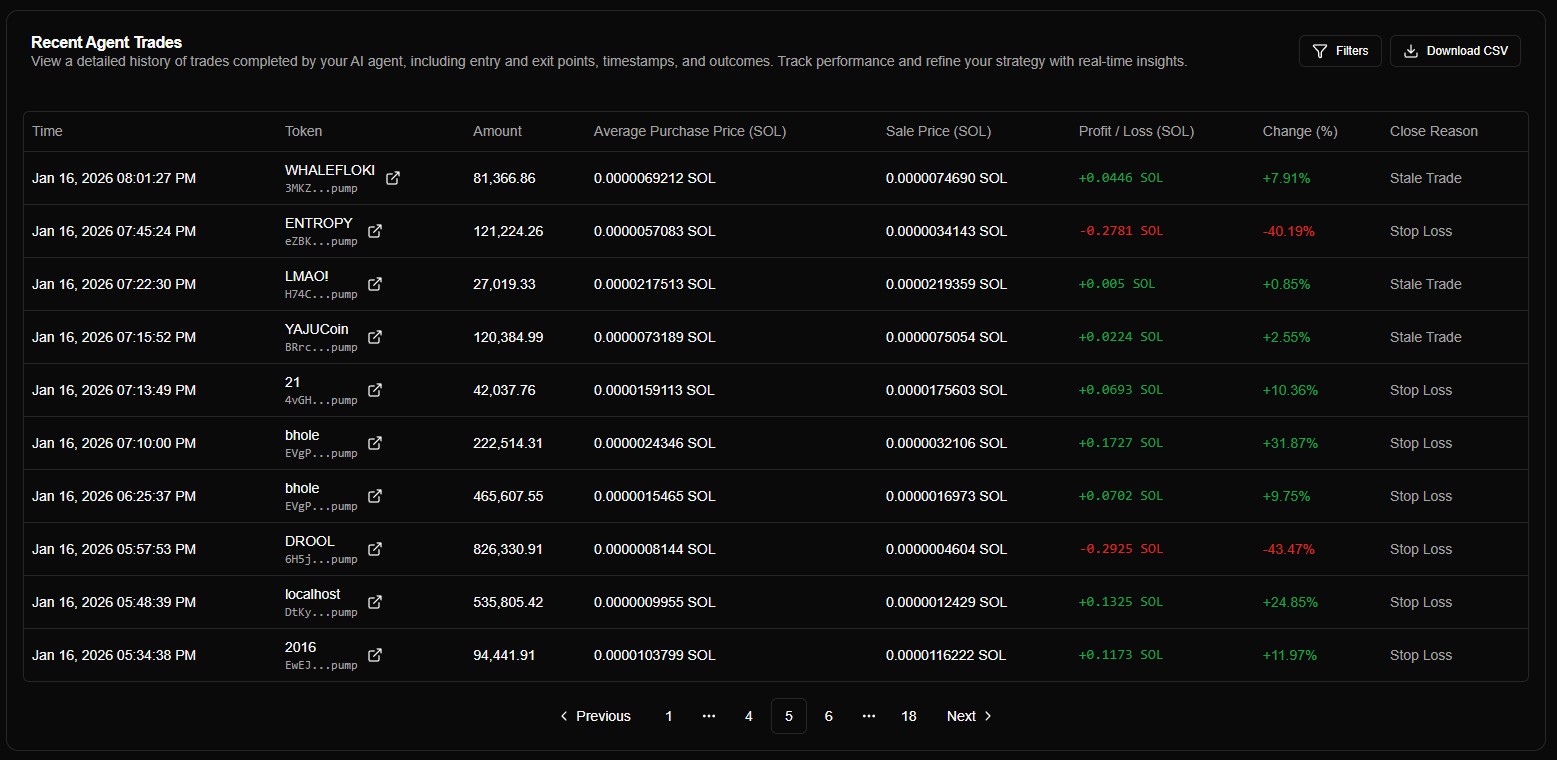
Recent Trades Table
A table showing your most recent closed positions:
| Column | Description |
|---|---|
| Time | Position closure time |
| Token | Token symbol |
| Amount | Position size |
| Average Purchase Price | Average purchase price (SOL or USD based on preference) |
| Sale Price | Sale price (SOL or USD based on preference) |
| Profit/Loss | Profit/loss amount (SOL or USD based on preference) |
| Change % | Percentage change from purchase to sale price |
| Closure Reason | How the position was closed (manual, stop loss, stale trade, etc.) |
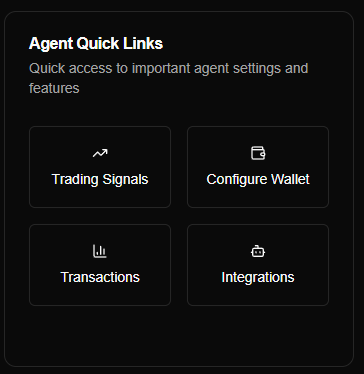
Agent Quick Links
Four quick-action buttons for common tasks:
| Button | Action |
|---|---|
| Trading Signals | Access signal management |
| Configure Wallet | Manage wallet settings |
| Transactions | View detailed transaction history |
| Integrations | Set up external services |
Navigation Features
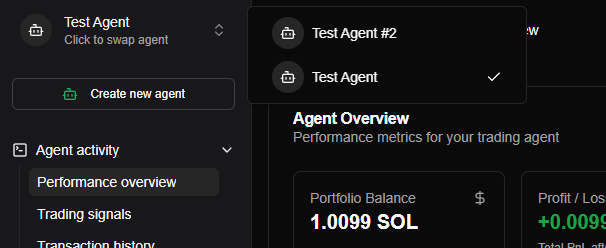
Agent Switcher
Located in the sidebar header:
- Click to see a dropdown of all your trading agents
- Select an agent to switch the entire dashboard context
- All metrics, positions, and data update to reflect the selected agent
You can create multiple agents with different strategies and switch between them easily.
Real-Time Updates
The dashboard uses WebSocket connections to provide real-time updates:
| Feature | Update Type |
|---|---|
| Live Positions | Update automatically as prices change |
| Balance Changes | Portfolio balance updates instantly |
| New Positions | New positions appear immediately |
| Position Closures | Closed positions move to Recent Trades automatically |
| Connection Status | Shows connection indicator in the header |
No page refresh needed - everything updates automatically!
Creating Your First Agent
If you haven't created an agent yet:
- Click "Create new agent" button in the sidebar
- Enter a name for your agent
- Configure your trading strategy (stop loss, DCA, etc.)
- Select simulation or live wallet
- Click "Create"
Once created, your agent appears in the Agent Switcher dropdown.
See Creating Agents for detailed setup instructions.
Dashboard Tips
Quick Navigation
| Method | Description |
|---|---|
| Sidebar icons | Fast navigation between pages |
| Agent Switcher | Manage multiple agents |
| Breadcrumbs | Navigate back to previous pages |
| Keyboard shortcuts | Use browser back/forward buttons |
Common Questions
Why don't I see any positions?
If you don't see any positions:
- Check your selected agent - Make sure you've selected the correct agent in the Agent Switcher
- Check trading mode - Positions are filtered by Simulation/Live mode